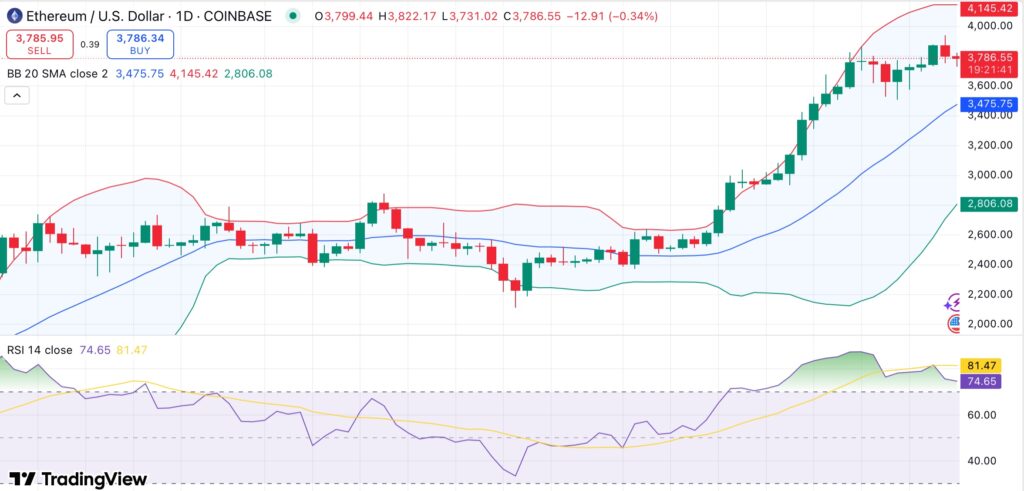
Ethereum is trading at $3,786, down about 3.7% from its local high of $3,933 recorded on July 28.
Summary
- ETH is still up 56% in the last 30 days despite a 3% pullback from $3,933 local top.
- Exchange reserves fell by over 1M ETH in the past month, signaling reduced sell pressure.
- ETH ETF inflows remain strong, while technicals show bullish momentum with short-term exhaustion.
The move marks a minor retracement after a sharp rally over the past 30 days, with the token still up 56%. While trading volume has dropped 12.2% over the last 24 hours to $26.1 billion, derivatives activity shows sustained market interest.
CoinGlass data shows that Ethereum (ETH) futures volume jumped 28.33% to $111.23 billion, even as open interest dipped slightly by 1.45% to $57.5 billion.
Rising volume alongside slightly lower open interest typically reflects short-term profit-taking or position rotation without major liquidation events. It suggests that traders are active but not overly leveraged.
1M ETH withdrawn from exchanges in one month
In the last 30 days, more than 1 million ETH have been taken out of centralized exchanges, according to a July 28 X post by analyst Ali Martinez. A steep drop in exchange-held reserves usually indicates that investors are shifting assets into non-custodial wallets or cold storage.
Frequently seen as an indication of long-term accumulation, this pattern lessens immediate sell-side pressure and may pave the way for future price increases.
In addition, Ethereum spot exchange-traded funds are still a source of strong demand. According to SoSoValue data, July 28 saw $65.14 million in net inflows. Total inflows for July have now crossed $5.1 billion, showing continued interest from institutional investors. This may help stabilize market confidence even in the face of short-term volatility.
Ethereum technical analysis
Ethereum’s strong upward trend is supported by its position above all significant moving averages on the daily chart. Trend alignment over timeframes is confirmed by ETH trading above its 10-, 20-, 50-, and 200-day EMAs and SMAs.

On the other hand, short-term oscillators show signs of fatigue. The relative strength index has reached overbought territory at 74.6 and the stochastic oscillator is getting close to 89, both of which point to a slowdown in the upward momentum.
These readings suggest that ETH may experience a brief decline or a period of consolidation before attempting higher levels. The MACD is still bullish with a strong positive crossover, but other indicators, like the stochastic RSI, are flattening, indicating potential hesitancy.
Ethereum is trading close to the upper Bollinger Band, which usually signals the start of a cooling-off period or a price reversion. If that happens, the $3,680–$3,700 range, which corresponds to the 10-day EMA, provides immediate support.
A sustained decline below that might trigger a more significant correction toward $3,480, but either macro pressure or an ETF demand reversal would likely be necessary for such a move.
On the upside, $4,000 would once again come into focus with a confirmed breakout above $3,960. The next leg of ETH’s move could aim for $4,200–$4,300 if volume picks back up and momentum stabilizes.


